SQLのDML処理の改善をする為には各RDBMSのオプティマイザーがそれぞれの環境でどのようにSQLを処理しているか知る必要があります。EXPLAINコマンドがMySQLでもPostgreSQLでも提供されていますが、結果の長い実行プランは可読性が良く無いので、読み解くまでに時間がかかってしまうので、MySQL、PostgreSQL共にExpalinの結果をVisualizeして確認する事が出来る様になっているので是非活用しましょう。
Explain on MySQL
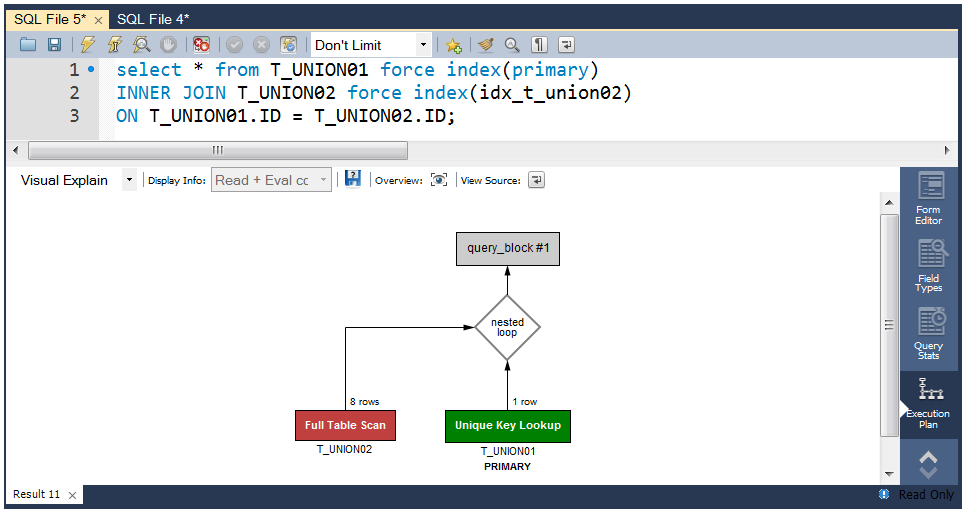
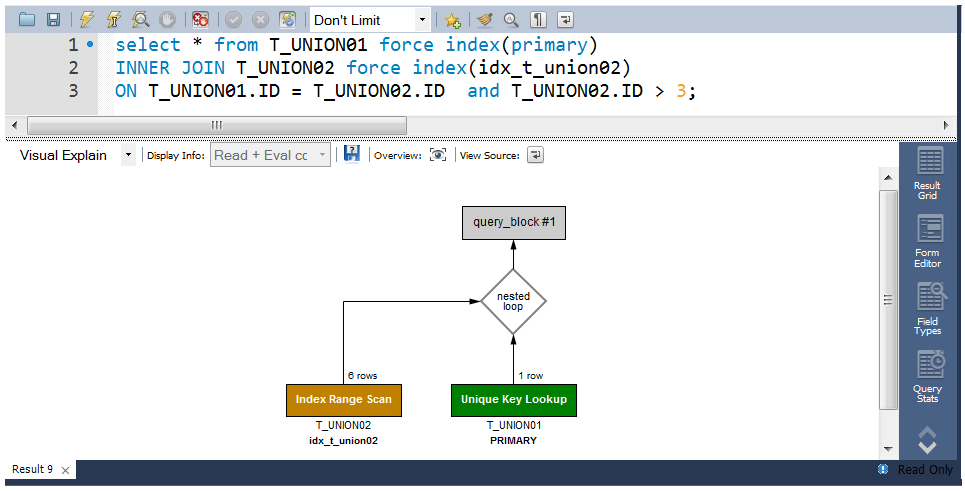
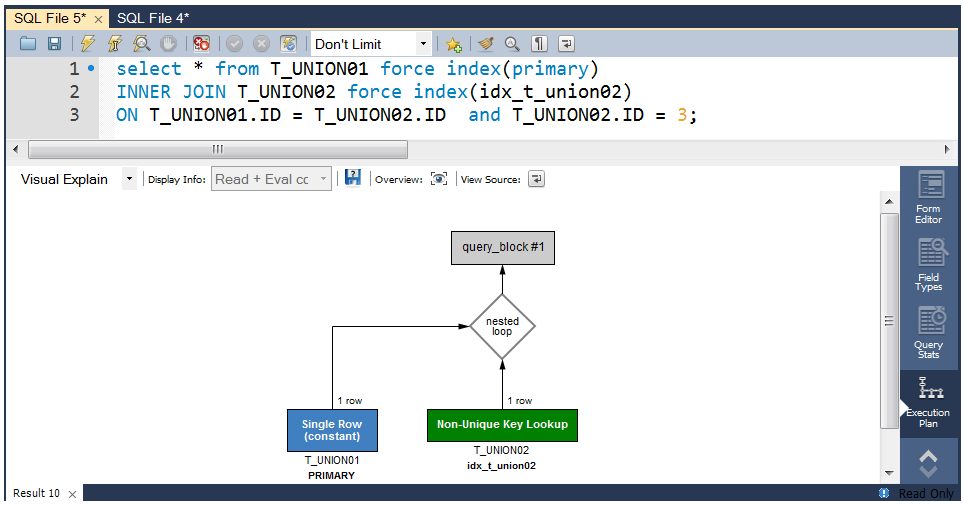
MySQLでは、EXPLAIN, EXPLAIN ANALYZE, EXPLAIN … FOR CONNECTION等を利用してCLIベースで実行プランを確認する事が出来ますが。Visualizeする場合は、以下の様にMySQLチームからオフィシャルに提供されているMySQL Workbenchで可視化すると非常に分かりやすいので便利です。
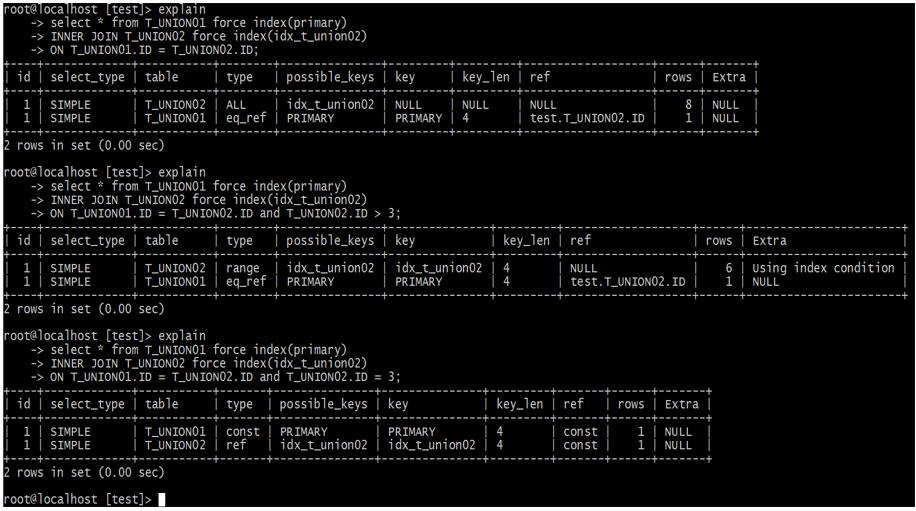
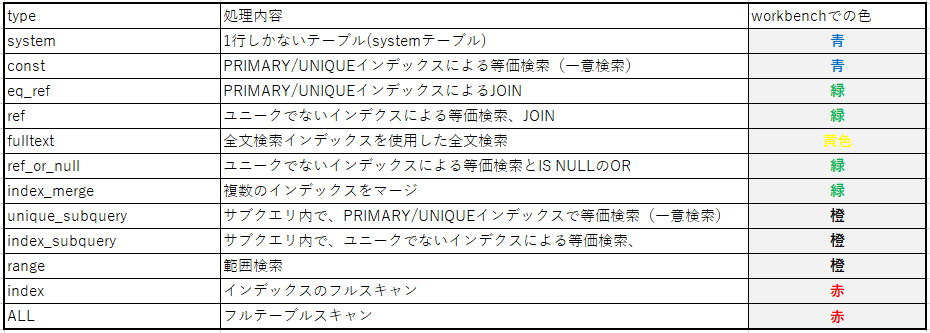
explainでselect_typeの次に意識しなければいけないのはtypeフィールドになります。
レコードアクセスタイプとも呼ばれ、対象のテーブルに対してどのような方法でアクセスするかを示しています。 問題になるクエリーはこのフィールドを見れば一目で分かるのでとても重要なフィールドとなります。
const・・・ PRIMARY KEYまたはUNIQUEインデックスのルックアップによるアクセス。最速。
eq_ref・・・JOINにおいてPRIARY KEYまたはUNIQUE KEYが利用される時のアクセスタイプ。
            constと似ていますがJOINで用いられるところが違う。
ref・・・   ユニーク(PRIMARY or UNIQUE)でないインデックスを使って等価検索(WHERE key = value)
            を行った時に使われるアクセスタイプ。
range・・・ インデックスを用いた範囲検索。
index・・・ フルインデックススキャン。インデックス全体をスキャンする必要があるのでとても遅い。
ALL・・・   フルテーブルスキャン。インデックスがまったく利用されていないことを示す。OLTP系の処理では改善必須。
WorkBenchのVisual Explainを利用すると視覚的な色をベースに直感的に判断する事が可能です。
Explain for connection
SQLを実行中のIDを指定して、EXPLAIN FOR CONNECTIONを実行すると実行中の処理が確認可能です。
root@localhost [APP]> explain for connection 8221;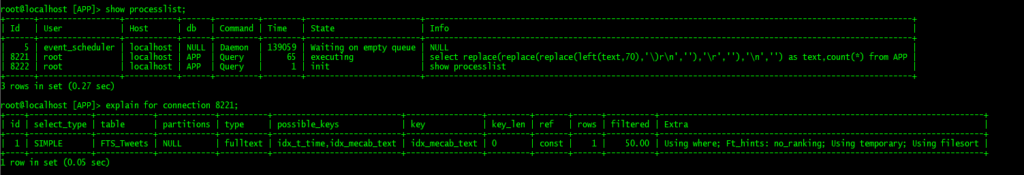
Expalin format=JSON
実行プランのコストなどの詳細を確認する事が出来ます。
mysql> EXPLAIN format=json  select id,name,age,ifnull(salary,0),regist from members where id = 1\G
*************************** 1. row ***************************
EXPLAIN: {
  "query_block": {
    "select_id": 1,
    "cost_info": {
      "query_cost": "1.00"
    },
    "table": {
      "table_name": "members",
      "access_type": "const",
      "possible_keys": [
        "PRIMARY"
      ],
      "key": "PRIMARY",
      "used_key_parts": [
        "id"
      ],
      "key_length": "4",
      "ref": [
        "const"
      ],
      "rows_examined_per_scan": 1,
      "rows_produced_per_join": 1,
      "filtered": "100.00",
      "cost_info": {
        "read_cost": "0.00",
        "eval_cost": "0.10",
        "prefix_cost": "0.00",
        "data_read_per_join": "1K"
      },
      "used_columns": [
        "id",
        "name",
        "age",
        "salary",
        "regist"
      ]
    }
  }
}
1 row in set, 1 warning (0.01 sec)
TYPE詳細
Explain on PostgreSQL
PostgreSQLもMySQL同様にExplain, Explain Analyze等を実行してSQLの実行プランを確認する事が可能です。Analyzeを実行した場合は、実際のSQLの処理も実行される為、参照処理以外のANALYZEオプションの利用は注意が必要です。
可視化するツールはPostgreSQLチームからオフィシャルに提供されてませんが、オープンソースで提供されているツールがあるのでそちらを利用する事で長い実行プランを読みやすくする事が出来るので非常に便利です。
POC=# select count(*) from trains;
  count
---------
 1000002
(1 row)

Time: 172.501 ms
POC=# select * from trains limit 1;
   id    |              name
---------+--------------------------------
 1100006 | sample data for unlogged table
(1 row)

Time: 2.151 ms


/*** Seq Scan :表を最初から最後へとスキャンする ***/


POC=# explain analyze select * from trains;
                                                    QUERY PLAN
-------------------------------------------------------------------------------------------------------------
 Seq Scan on trains  (cost=0.00..18334.02 rows=1000002 width=35) (actual time=0.026..88.213 rows=1000002 loops=1)
 Planning Time: 0.063 ms
 Execution Time: 128.722 ms
(3 rows)

Time: 129.657 ms
POC=# explain analyze select * from trains limit 1;
                                                   QUERY PLAN
-------------------------------------------------------------------------------------------------------------
 Limit  (cost=0.00..0.02 rows=1 width=35) (actual time=0.014..0.015 rows=1 loops=1)
   ->  Seq Scan on trains  (cost=0.00..18334.02 rows=1000002 width=35) (actual time=0.013..0.013 rows=1 loops=1)
 Planning Time: 0.067 ms
 Execution Time: 0.031 ms
(4 rows)

Time: 1.203 ms


/*** Index Scan+Index Cond: インデックスを利用してデータを取得 ***/
/*** Index Condが無い場合は、ソートの代わりとして使われるインデックス順のフルスキャンとなる ***/
/*** インデックスとテーブルを交互にアクセスしてデータを取得 ***/

POC=# explain analyze select * from trains where id = 100;
                                                    QUERY PLAN
-------------------------------------------------------------------------------------------------------------
 Index Scan using trains_pk on trains  (cost=0.42..8.44 rows=1 width=35) (actual time=0.022..0.022 rows=0 loops=1)
   Index Cond: (id = 100)
 Planning Time: 0.086 ms
 Execution Time: 0.043 ms
(4 rows)

Time: 1.141 ms

POC=# explain analyze select * from trains where id >= 100 and id < 8000 ;
                                                    QUERY PLAN
-------------------------------------------------------------------------------------------------------------
 Index Scan using trains_pk on trains  (cost=0.42..8.45 rows=1 width=35) (actual time=0.011..0.012 rows=0 loops=1)
   Index Cond: ((id >= 100) AND (id < 8000))
 Planning Time: 2.347 ms
 Execution Time: 0.077 ms
(4 rows)

Time: 7.395 ms

/*** Seq Scan:データ量が多く、Indexが有ってもテーブルを最初から最後までチェックして必要な行を探す ***/

POC=# explain analyze select * from trains where id >= 100 and id < 5028000;
                                                    QUERY PLAN
-------------------------------------------------------------------------------------------------------------
 Seq Scan on trains  (cost=0.00..23334.03 rows=1000002 width=35) (actual time=0.042..209.092 rows=1000002 loops=1)
   Filter: ((id >= 100) AND (id < 5028000))
 Planning Time: 2.190 ms
 Execution Time: 249.680 ms
(4 rows)

Time: 252.666 ms
POC=#


/*** Index Only Scan:インデックスのみを利用してピンポイントでデータを取得 ***/
/*** インデックスのみからデータを取得する事が可能 ***/

POC=# explain analyze select id from trains where id = 100;
                                                      QUERY PLAN
-------------------------------------------------------------------------------------------------------------
 Index Only Scan using trains_pk on trains  (cost=0.42..4.44 rows=1 width=4) (actual time=0.019..0.020 rows=0 loops=1)
   Index Cond: (id = 100)
   Heap Fetches: 0
 Planning Time: 0.102 ms
 Execution Time: 0.115 ms
(5 rows)

Time: 1.234 ms


/*** Bitmap Scan:インデックスを利用してORで結合した条件などの時に有効 ***/

POC=# explain analyze select * from trains where (id >= 100 and id < 18000) or (id >=3000 and id < 10000);
                                                       QUERY PLAN
-------------------------------------------------------------------------------------------------------------
 Bitmap Heap Scan on trains  (cost=8.87..12.89 rows=1 width=35) (actual time=0.012..0.014 rows=0 loops=1)
   Recheck Cond: (((id >= 100) AND (id < 18000)) OR ((id >= 3000) AND (id < 10000)))
   ->  BitmapOr  (cost=8.87..8.87 rows=1 width=0) (actual time=0.010..0.011 rows=0 loops=1)
         ->  Bitmap Index Scan on trains_pk  (cost=0.00..4.43 rows=1 width=0) (actual time=0.007..0.007 rows=0 loops=1)
               Index Cond: ((id >= 100) AND (id < 18000))
         ->  Bitmap Index Scan on trains_pk  (cost=0.00..4.43 rows=1 width=0) (actual time=0.002..0.002 rows=0 loops=1)
               Index Cond: ((id >= 3000) AND (id < 10000))
 Planning Time: 0.324 ms
 Execution Time: 0.043 ms
(9 rows)

Time: 1.881 ms


/*** Sort:データがwork_memに収まればquicksortとなりメモリー内部でソートなので早い ***/

POC=# explain analyze select * from trains where (id >= 100 and id < 18000) or (id >=3000 and id < 10000) order by id;
                                                          QUERY PLAN
-------------------------------------------------------------------------------------------------------------
 Sort  (cost=12.90..12.91 rows=1 width=35) (actual time=0.022..0.024 rows=0 loops=1)
   Sort Key: id
   Sort Method: quicksort  Memory: 25kB
   ->  Bitmap Heap Scan on trains  (cost=8.87..12.89 rows=1 width=35) (actual time=0.014..0.015 rows=0 loops=1)
         Recheck Cond: (((id >= 100) AND (id < 18000)) OR ((id >= 3000) AND (id < 10000)))
         ->  BitmapOr  (cost=8.87..8.87 rows=1 width=0) (actual time=0.013..0.013 rows=0 loops=1)
               ->  Bitmap Index Scan on trains_pk  (cost=0.00..4.43 rows=1 width=0) (actual time=0.009..0.009 rows=0 loops=1)
                     Index Cond: ((id >= 100) AND (id < 18000))
               ->  Bitmap Index Scan on trains_pk  (cost=0.00..4.43 rows=1 width=0) (actual time=0.003..0.003 rows=0 loops=1)
                     Index Cond: ((id >= 3000) AND (id < 10000))
 Planning Time: 0.248 ms
 Execution Time: 0.138 ms
(12 rows)

/*** Unique:重複する値を削除 ***/

POC=# explain analyze select distinct(id) from trains;
                                                                  QUERY PLAN
-------------------------------------------------------------------------------------------------------------
 Unique  (cost=0.42..28480.46 rows=1000002 width=4) (actual time=0.044..388.635 rows=1000002 loops=1)
   ->  Index Only Scan using trains_pk on trains  (cost=0.42..25980.45 rows=1000002 width=4) (actual time=0.042..179.450 rows=1000002 loops=1)
         Heap Fetches: 0
 Planning Time: 0.081 ms
 Execution Time: 437.045 ms
(5 rows)

Time: 438.126 ms

POC=# explain analyze select distinct(name) from trains;
                                                       QUERY PLAN
-------------------------------------------------------------------------------------------------------------
 HashAggregate  (cost=20834.03..20834.03 rows=1 width=31) (actual time=340.787..340.788 rows=2 loops=1)
   Group Key: name
   Batches: 1  Memory Usage: 24kB
   ->  Seq Scan on trains  (cost=0.00..18334.02 rows=1000002 width=31) (actual time=0.007..90.076 rows=1000002 loops=1)
 Planning Time: 0.046 ms
 Execution Time: 340.809 ms
(6 rows)

Time: 341.593 ms
POC=#


POC=# explain analyze select distinct(id) from trains where (id >= 100 and id < 18000) or (id >=3000 and id < 10000) order by id;
                                                             QUERY PLAN
-------------------------------------------------------------------------------------------------------------
 Unique  (cost=12.90..12.91 rows=1 width=4) (actual time=0.041..0.045 rows=0 loops=1)
   ->  Sort  (cost=12.90..12.91 rows=1 width=4) (actual time=0.040..0.042 rows=0 loops=1)
         Sort Key: id
         Sort Method: quicksort  Memory: 25kB
         ->  Bitmap Heap Scan on trains  (cost=8.87..12.89 rows=1 width=4) (actual time=0.029..0.030 rows=0 loops=1)
               Recheck Cond: (((id >= 100) AND (id < 18000)) OR ((id >= 3000) AND (id < 10000)))
               ->  BitmapOr  (cost=8.87..8.87 rows=1 width=0) (actual time=0.022..0.023 rows=0 loops=1)
                     ->  Bitmap Index Scan on trains_pk  (cost=0.00..4.43 rows=1 width=0) (actual time=0.017..0.017 rows=0 loops=1)
                           Index Cond: ((id >= 100) AND (id < 18000))
                     ->  Bitmap Index Scan on trains_pk  (cost=0.00..4.43 rows=1 width=0) (actual time=0.002..0.002 rows=0 loops=1)
                           Index Cond: ((id >= 3000) AND (id < 10000))
 Planning Time: 0.301 ms
 Execution Time: 0.108 ms
(13 rows)

Time: 1.310 ms


/*** Aggregate:重複する値を削除して複数の行を1行に集約 ***/

POC=# explain analyze select count(id) from trains;
                                                                QUERY PLAN
-------------------------------------------------------------------------------------------------------------
 Finalize Aggregate  (cost=14542.56..14542.57 rows=1 width=8) (actual time=66.374..67.897 rows=1 loops=1)
   ->  Gather  (cost=14542.34..14542.56 rows=2 width=8) (actual time=66.099..67.890 rows=3 loops=1)
         Workers Planned: 2
         Workers Launched: 2
         ->  Partial Aggregate  (cost=13542.34..13542.35 rows=1 width=8) (actual time=62.505..62.506 rows=1 loops=3)
               ->  Parallel Seq Scan on trains  (cost=0.00..12500.67 rows=416668 width=4) (actual time=0.030..33.145 rows=333334 loops=3)
 Planning Time: 0.152 ms
 Execution Time: 68.080 ms
(8 rows)

Time: 69.828 ms

POC=# explain analyze select id,count(id) from trains group by id;
                                                                  QUERY PLAN
-------------------------------------------------------------------------------------------------------------
 GroupAggregate  (cost=0.42..40980.49 rows=1000002 width=12) (actual time=0.048..470.338 rows=1000002 loops=1)
   Group Key: id
   ->  Index Only Scan using trains_pk on trains  (cost=0.42..25980.45 rows=1000002 width=4) (actual time=0.038..121.336 rows=1000002 loops=1)
         Heap Fetches: 0
 Planning Time: 0.079 ms
 Execution Time: 513.113 ms
(6 rows)

Time: 514.318 ms
- 実行プランの元となる基本データ
select schemaname,tablename,attname,inherited,null_frac,avg_width,
n_distinct,left(histogram_bounds::text,30),correlation
from pg_stats where tablename = 'trains';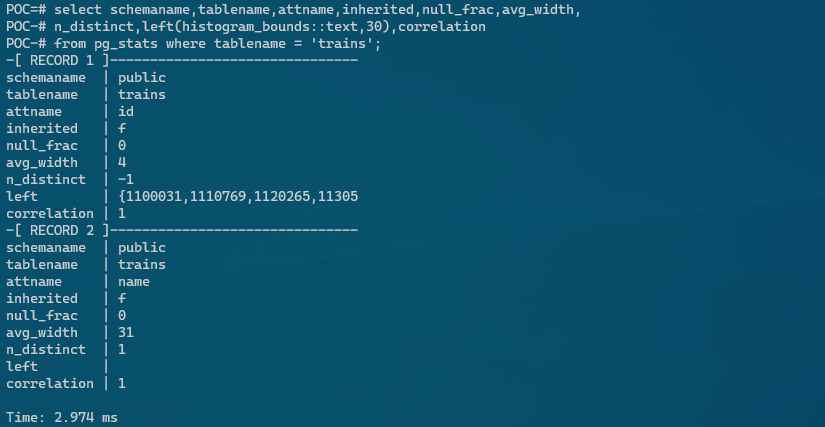
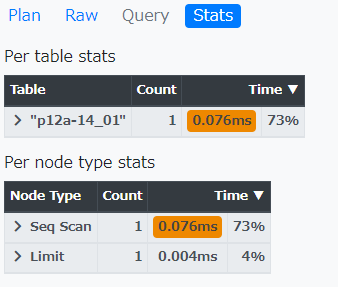
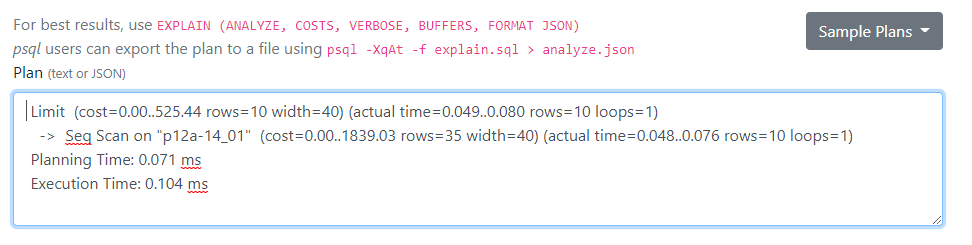
Explain結果の可視化
Pev2というツールがCompile済みのTarが準備されているので非常に便利で分かり易いです。
以下の様に、EXPALIN ANALYZEの結果を張り付けて上げると可視化してくれます。
POC=# select p12_001,p12_002,
ST_X(ST_Centroid(ST_Transform(geom, 4326))) AS long,
ST_Y(ST_Centroid(ST_Transform(geom, 4326))) AS lat
from "p12a-14_01" limit 10;
 p12_001 |   p12_002    |        long        |        lat
---------+--------------+--------------------+--------------------
   10022 | 大雪山       | 142.85420010160806 |   43.6636206598375
   10028 | 利尻山       | 141.24202302994075 |  45.17848605936035
   10019 | 羊蹄山       | 140.81121805004122 |  42.82822319916714
   10018 | 駒ヶ岳       |  140.6860528893914 | 42.065889439398575
   10024 | 十勝岳連山   | 142.68604910040537 | 43.417843671767066
   10029 | 斜里岳       | 144.71794277638253 |  43.76567263086662
   10026 | サロベツ原野 | 141.69903725156732 | 45.091089361848084
   10013 | 釧路湿原     | 144.40048171739738 |  43.10513200906569
   10033 | 霧多布湿原   | 145.07577566927762 | 43.083032411348654
   10020 | 雨竜沼湿原   | 141.60188935971385 |  43.69970475866003
(10 rows)

POC=# explain analyze select p12_001,p12_002,
POC-# ST_X(ST_Centroid(ST_Transform(geom, 4326))) AS long,
POC-# ST_Y(ST_Centroid(ST_Transform(geom, 4326))) AS lat
POC-# from "p12a-14_01" limit 10;
                                                    QUERY PLAN
---------------------------------------------------------------------------------------------------------------
 Limit  (cost=0.00..525.44 rows=10 width=40) (actual time=0.049..0.080 rows=10 loops=1)
   ->  Seq Scan on "p12a-14_01"  (cost=0.00..1839.03 rows=35 width=40) (actual time=0.048..0.076 rows=10 loops=1)
 Planning Time: 0.071 ms
 Execution Time: 0.104 ms
(4 rows)

POC=#- Tarを展開して、フォルダー毎ブラウザーで開ける場所に配置して、Index.htmlを開くと以下の管理画面が出てくるので、上記の様に取得した実行プランの結果を張り付けてSubmitすると実行プランを可視化する事が出来ます。
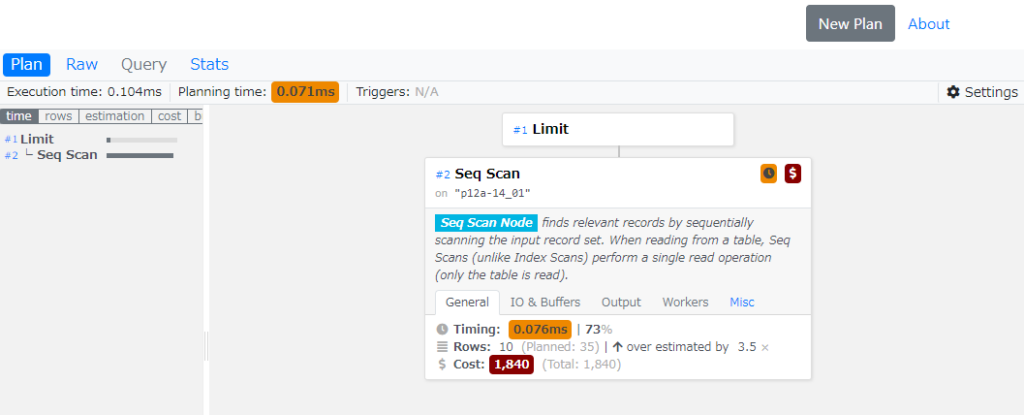
留意:loops値はそのノードを実行する総回数を報告し、表示される実際の時間と行数は1実行当たりの平均です。 これで値を表示された推定コストと比較できるようになります。 loops値をかけることで、そのノードで実際に費やされた総時間を得ることができます。
参照:https://www.postgresql.jp/document/11/html/using-explain.html
- Pev2についての詳細は此方を確認下さい。
可視化ツール:pev2 / Pev2ダウンロード:Pev2 Compile済みv0.24.0 / NPM: pev2-cli
その他、PostgreSQLの実行プラン可視化ツール